Understanding Japanese Candlestick Patterns
Japanese candlestick charting techn
iques have become a cornerstone of modern technical analysis in financial markets. Originating in Japan over 300 years ago, these methods were developed by rice traders to track price movements. Today, traders worldwide use Japanese candle patterns to predict market trends and make informed decisions.
What Are Japanese Candlestick Charting Techniques?
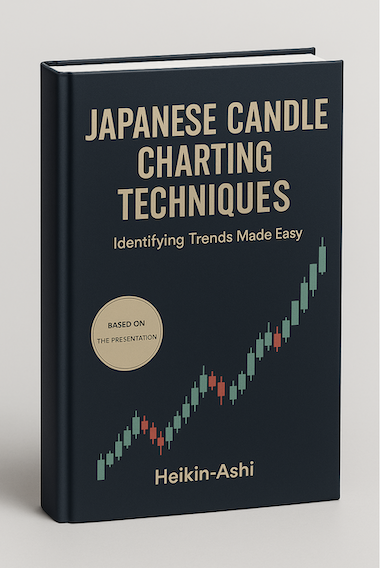
Japanese candlestick charting techniques involve representing price movements through visual „candles“ on a chart. Each candle displays the opening, closing, high, and low prices for a specific time period. The body of the candle shows the range between the opening and closing prices, while the wicks (or shadows) indicate the high and low. This method, detailed in the seminal Japanese candlestick charting techniques book by Steve Nison, provides insights into market sentiment and potential reversals.
Key Japanese Candle Patterns
Japanese candle patterns are formations that signal potential market movements. Some common patterns include:
-
Doji: A candle where the opening and closing prices are very close, indicating indecision in the market.
-
Hammer: A bullish reversal pattern with a small body and a long lower wick, often appearing after a downtrend.
-
Engulfing Pattern: A two-candle pattern where a small candle is followed by a larger one that „engulfs“ it, signaling a potential trend reversal.
-
Morning Star: A three-candle bullish reversal pattern that appears after a downtrend, indicating a shift to buying pressure.
These patterns, thoroughly explored in the Japanese candlestick charting book, help traders identify opportunities with greater precision.
Why Use Japanese Candlestick Charting Techniques?
The power of Japanese candlestick pattern analysis lies in its ability to convey complex market information visually. Unlike traditional bar charts, candlesticks highlight price relationships and momentum shifts clearly. The Japanese candlestick charting techniques book emphasizes their versatility across markets, from stocks to forex and cryptocurrencies.
Traders value these techniques for their:
-
Clarity: Patterns are easy to spot and interpret.
-
Predictive Power: They often signal reversals or continuations before they occur.
-
Universality: Applicable to any time frame or asset class.
Learning More About Japanese Candlestick Patterns
For those eager to master Japanese candle charting techniques, Steve Nison’s Japanese candlestick charting techniques book is a must-read. It offers a comprehensive guide to understanding and applying these patterns effectively. Online resources, trading platforms, and communities also provide practical insights into using Japanese candlestick patterns in real-world trading.
Conclusion
Japanese candlestick charting techniques offer a time-tested approach to understanding market dynamics. By studying Japanese candle patterns, traders can gain an edge in predicting price movements. Whether you’re a beginner or an experienced trader, diving into the world of candlestick analysis, starting with the Japanese candlestick charting book, can enhance your market expertise.
